Showing posts with label Math Notes. Show all posts

Monday, June 6, 2011

Notes for June 06, 2011


Measure of Central Tendency- a value that represents the centre of a data set.
- can be the mean, medi
an and mode.

Data set- is a group of numbers that you mus
t arrange in order from least to greatest.
e.i 2,4,3,5,3,4,5,5,6,4,5,3,7,34,5,6

arrange from least to greatest: 2,3,3,3,4,4,4,5,5,5,5,5,6,6,7,34

Note: Before you find the Median, Me
an or Mode be sure that you arranged it from least to greatest.

Median- the middle number in a set of data after the data have been arranged in order.


If you left with two numbers you need to add them and divide them to get the median.
e.i


Mode- the most frequently occurring number in a set of data.
- mode and most have both 4 letters.
e.i
mode of 3,5,7,7,9 is 7 because 7 appeare
d the most.
mode of 1,1,1,2,2,2,3,3,3,4 is 1,2 and 3 because they appeared the most.
mode of 1,1,1,2,2,2,3,3,3 is no mode b
ecause they`re all last or second place.

Mean- a measure of central tendency.
- the sum of a set of values divided by the number of values in a set.


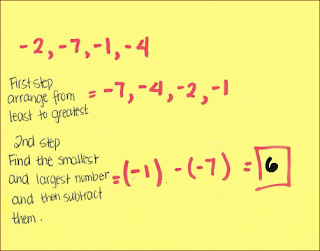
Range- the positive differences between the largest and smallest values in a data set.

Outlier- a value that is much larger or smaller than the other data value.
- the data set may have more than 1 outlier or zero outlier.

e.i
1,67,68,64,65,100 are 1 and 100 because the rest of them starts with 6 except for 1 and 100.

Here`s our homework for those who did not write it.

Find mean, median, mode, range and outliers.

18,19,79,17,20,12
14,14,16,15,16
98,202,99,91,2,95,89,88,94
Here`s a link to help you practice for mean, median, mode, range and outliers.

I also found a video to help you understand all about our lesson.

I hope this little information help you! :D

Math Notes

Measures of central Tendency
- A value that represents the centre of a data set
-It can be Mean, Medium or Mode
-A data set is a group of numbers that you must arrange in order from least to greatest.


Median- the middle number in a set of data after the data have been arranged in order


If this^ happens, all you have yo do is find out what number is in between the two numbers. So take 6 and 8, You know that 7 is in between so, 7 is our median. Another way to find out the median...
Take the two middle numbers (6 and 8) add them together (6+8) and that would equal 14 right? So, you take 14, and divide it by 2 (14÷2) and that would equal 7, and seven (7) is our Median.


If this^ happens, remember the first thing you do when you get a data, you have to arrange them from least to greatest, after you do that and you get two numbers in the middle and you wanted to find out the Median, remember: take the two middle numbers (3 and 10) add them together (3+10) and that would equal 13 right? So, you take 13, and divide it bye 2 (13÷2) and that would equal 13, and thirteen (13) is our Median.

Mode- the most frequent occuring in a set of data. Here is how you can remember the meaning, MODE and MOST have both 4 letters and they both start in "MO".

(e.g) 3,5,7,7,9
the Mode would be "7" because it's the most occuring number, there are two of them and only one the other numbers.
(e.g) 2,2,4,6,6,8,11
the Mode would be 2 and 6, because there are two and them and they are both tied for having two numbers.
(e.g) 1,1,1,2,2,2,3,3,3
the Mode is nothing because there are three of them for each number.
(e.g) 1,1,1,2,2,2,3,3,3,4
If this happens, the mode this time would be 1,2 and 3, because they are all tied for being first.

Mean- A measure of central tendency. Th sum of a set of values divided by the number of values in the set.


The Mean in this^ image is 6, because the data states 4, 6, and 8, So you take all the numbers in the data (4, 6, and 8) and then add them up (4+6+8) and then that would equal 18 right? So, take 18 and divide it by how much numbers there are in the data, In this data there are 3 numbers, (18÷3) and that would equal to 6, So 6 is our Mean.


Range- The positive difference between the largest and smallest values in a data set.


If this^ happens, always remember when you get a data set, you have to order them from least to greatest, after you do that you take the biggest number (in this situation it's #9) and the smallest number (in this situation it's the #1) and subtract the biggest number to the smallest number (9-1=8) and that would equal to 8, so 8 is our Range.


Outlier- A value that is much longer or smaller than the other data value, the data set may have more than 1 outlier or zero outliers.


The outliers for 1,67,68,67,64,65,100 would be 1 and 100, because the rest of the numbers are somewhere in the 60's and 1 and 100 are so far off.


MATH HOMEWORK FOR TODAY:


Find out the Mean, Mode, Range, Outliers, for the following data set.
1.) 18,19,79,17,20,12


2.)14,14,16,15,1,16


3.)98,202,99,91,2,95,89,88,94


*Here is a LINK where you can learn more facts about Measures of Central Tendency.


*Here is also a link to a VIDEO about Mean, Median and Mode.


Sunday, June 5, 2011

Math Notes

Here are just some notes that we took down.
You might want to review some of them if you're having trouble.
I also added examples for most of them.
The images below explains Variables, Expressions, Value, Constant and Numerical Coefficient.


Here is a LINK you might want to click if you want to practice writing expressions.

I also found a VIDEO about how to write an expression.

Saturday, June 4, 2011

Math Notes


*If you're having trouble with this^ example, here is a video about SUBTRACTING integers. If you also would like to see a video about ADDING integers, here is another one.


Here is also a WEBSITE about equations.


*These were the notes we took down on Friday, I'm sorry if I posted it a little late.


HOMEWORK: Finish homework booklet pages 134-139.. and finish Chapter Review and Practice Test in our TEXTBOOK.